Processed Food Patterns
Convenience Foods and the Architecture of Everyday Reliance
Eleanor Whitfield·
A review of UK supermarket labelling practices across 240 standard grocery products reveals that added sugar appears under at least 14 distinct ingredient names, distributed across product categories where consumers least expect significant sugar content. The cumulative effect on daily intake estimation is substantial and largely invisible without systematic label analysis.
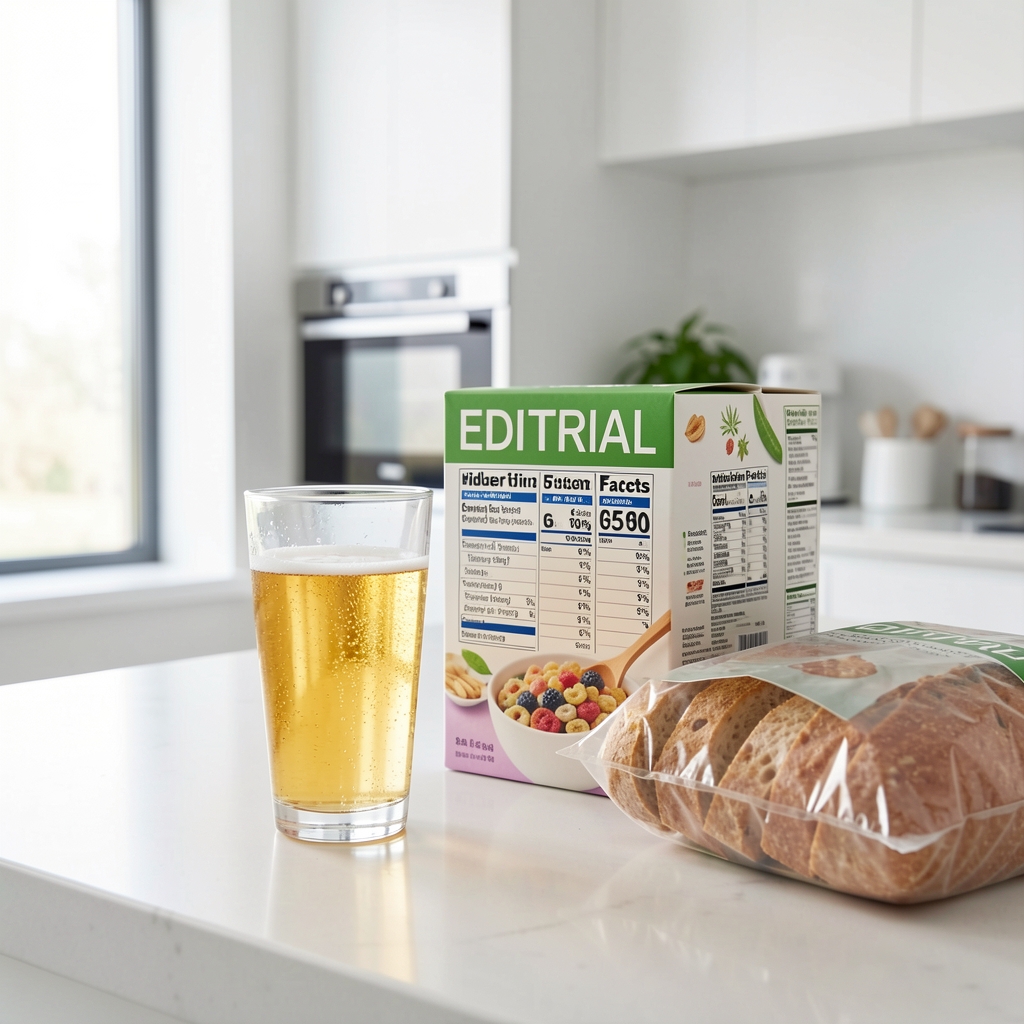
Labelling review — London, 2026 · Product analysis, batch 07
UK food labelling regulations require manufacturers to list ingredients in descending order by weight, a convention that provides a basis for identifying sugar content relative to other ingredients. In practice, however, the application of this requirement is complicated by the number of distinct ingredient names under which added sugar is permitted to appear — each representing a chemically distinct form of sugar, but each contributing to total daily sugar intake in the same functional sense.
An analysis of ingredient declarations across 240 standard UK supermarket products identified sugar-derived ingredients appearing under the following designations, among others: sucrose, glucose-fructose syrup, high-fructose corn syrup, dextrose, maltose, lactose (in non-dairy contexts as an additive), treacle, molasses, invert sugar, barley malt extract, rice syrup, agave syrup, honey (as a processing ingredient), and fruit juice concentrate. Each of these, when listed separately, contributes to total sugar intake while potentially registering low in the ingredient order when no individual source represents a dominant proportion by weight.
The practical implication is straightforward: a product listing six sugar-derived ingredients — each in the middle third of its ingredient list — may have a combined added sugar content equivalent to a product for which sucrose is the second-most prominent ingredient by weight, while appearing, from a label inspection, to contain minimal sugar. This is not a labelling violation; it is a consequence of the categorical structure of ingredient declaration requirements.
The product categories in which the labelling complexity above has the greatest practical effect are not, in most cases, the product categories that consumers most associate with high sugar content. The confectionery and carbonated drinks categories are generally well-recognised as high-sugar; consumer awareness of sugar content in these categories is comparatively high. The categories where hidden sugar concentration is most significant relative to consumer expectation are different ones.
Bread and bakery products: analysis of 28 standard sliced bread products found an average added sugar content of 3.2g per 100g, with a range from 1.1g to 6.8g. The category is not typically considered a sugar source, yet two slices of bread from the higher end of this range contributes approximately 3.4g of added sugar — a non-trivial contribution to the UK reference intake of 30g per day for free sugars.
"Standard savoury cooking sauces registered the largest average variance between consumer-estimated and actual sugar content: consumers estimated an average of 2.1g per serving; measured content averaged 8.7g."
Oratelin Journal product review · Product batch 07, April 2026
Savoury sauces and condiments present the most significant category-level gap between perceived and actual sugar content. Pasta sauces, stir-fry sauces, and salad dressings analysed in this review contained between 5.2g and 14.3g of added sugar per standard serving. The savoury framing of these products — they are used as cooking ingredients or accompaniments to non-sweet meals — creates a category expectation of low sugar content that the actual formulations do not support.
Liquid calories occupy a distinct position in sugar intake analysis because of a well-documented characteristic of beverage consumption: calories consumed in liquid form produce weaker satiety signalling than equivalent calories consumed in solid form. This phenomenon — consistently replicated in dietary research across multiple population groups — means that the body does not compensate for beverage caloric intake by reducing intake from other sources in the same way it does for solid food calories.
For sugar specifically, this characteristic creates an intake pathway that operates largely outside the normal appetite-regulation system. A 500ml bottle of a standard flavoured soft drink contains approximately 52g of added sugar — 73% above the UK daily reference intake for free sugars — while registering no meaningful satiety effect. The same 52g of sugar consumed in solid form, distributed across several food items, would register appetite signals and adjust subsequent eating behaviour; the liquid form does not.
The category extends beyond carbonated drinks. Fruit juices — including those labelled "no added sugar" — contain naturally occurring sugars at concentrations similar to, and sometimes exceeding, those of flavoured soft drinks. Smoothies and blended fruit-based beverages present similar profiles, with the additional characteristic that portion sizes tend to be larger than equivalent solid-food servings of the same ingredients, because the liquid form increases consumption rate and reduces perceived portion volume.
Refined carbohydrates — those in which the fibre, germ, and bran components have been removed through processing — include white bread, white rice, standard pasta, and the processed grain ingredients used as bases in the majority of packaged food products. Their relevance to weight-related patterns is distinct from, though related to, their sugar content.
The primary documented mechanism connects to glycaemic response: refined carbohydrates are absorbed more rapidly than their whole-grain equivalents, producing more acute postprandial blood glucose changes. The subsequent return to baseline is associated with increased appetite and earlier recurrence of hunger relative to equivalent caloric intake from whole-grain sources. This faster hunger cycle, when embedded in a diet dominated by refined carbohydrates, increases the frequency of eating occasions and raises the probability of between-meal consumption.
The practical relevance of this mechanism is that it operates at the level of habitual meal composition rather than at the level of individual food choices. A diet in which the carbohydrate base is predominantly refined creates a structural condition for increased eating frequency that persists regardless of the caloric quality or composition of individual meals. Adjusting the carbohydrate source — introducing whole grains as a substitution rather than an addition — is one of the more precisely documented approaches to moderating this cycle in the published nutritional literature.
Given the labelling structure documented above, a category-intuition-based approach to identifying high-sugar products is insufficiently accurate for consistent dietary management. Products in unexpected categories — bread, savoury sauces, flavoured yoghurts, breakfast cereals — contribute meaningfully to daily intake in ways that are difficult to estimate without direct label review.
A more reliable approach focuses on the "of which sugars" line in the nutrition declaration table, which reports total sugar content per 100g independent of how many ingredient names contribute to that total. This single figure — expressed per 100g — allows direct comparison across product variants and categories without requiring interpretation of the ingredient list. Products scoring above 22.5g of sugars per 100g are categorised as high-sugar under the UK traffic light labelling scheme; products below 5g per 100g are categorised as low-sugar.
The per-serving figure on the same declaration provides a second useful reference, but requires attention to the stated serving size, which manufacturers may set below the amount typically consumed in a single eating occasion. Cross-referencing the per-100g figure with an estimated actual portion size provides the most accurate basis for intake estimation across product categories.